ETL Pipeline Project: NYC Taxi Data
Designed and implemented an end-to-end ETL for New York City Taxi Data using Python, Docker, and PostgreSQL database.

Introduction
I’ve always had a deep appreciation for structure and cleanliness — not just in the physical world, but especially in data. During my final thesis, I developed an NLP-based application and had to deal with messy, unstructured text from various sources. Surprisingly, instead of feeling overwhelmed, I truly enjoyed the process of cleaning, transforming, and organizing the raw data into something usable and reliable. That experienced sparked my passion for data engineering. There’s unique satisfaction in turning chaos into structure, and ever since, I’ve been determined to pursued this path. This project marks the beginning of my journey to strengthen my foundation as a Data Engineer. Through every step of process, I hope to keep learning, growing, and building better data systems.
Project Overview
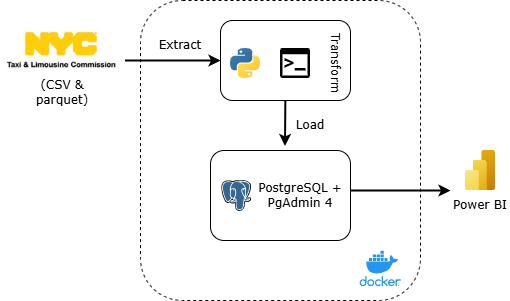
This project demonstrates a complete ETL (Extract, Transform, Load) pipeline using Python, PostgreSQL and Docker to process the New York City Taxi Trip dataset. The main goal is to extract raw data from a public URL, perform necessary transformations to clean the data, load the processed data into a data warehouse and visualize it. I used GitHub Codespaces as my primary development environment which provided a fast and consistent setup, especially for working with Docker and PostgreSQL in cloud-based workspace.
Key components of this project:
- Data Extraction: Downloading raw CSV data from the NYC Taxi public dataset using Python.
- Data Transformation: Cleaning the data.
- Data Loading: Saving the transformed data into PostgreSQL
- Containerization: All steps are wrapped and executed in a Dockerized environment to ensure reproducibility and isolation.
- Data Visualization: Connecting Power BI to the PostgreSQL database to create interactive dashboard and visual insights.
The diagram below shows the workflow of this project.
Dataset
For this project, I worked with the Yellow and Green Taxi Trip datasets of January 2025 and Taxi Zone dataset, available as public parquet and CSV files from The New York City Taxi and Limousine Commission (TLC) website. The datasets contain millions of rows of real-world taxi trip data. The datasets schema can also be viewed these pages Yellow and Green
Tech stack and Tools
- GitHub Codespaces (for cloud-based development)
- Python
- Docker
- PostgreSQL & PgAdmin 4
- Power BI
Project Workflow
Here’s a breakdown of how i approached this project—from getting messy taxi data to turning it into clean insights.
1. Deploying PostgreSQL database and PgAdmin 4
In this project, I used Docker to deploy a PostgreSQL database and PgAdmin 4. PostgreSQL serves as the data warehouse for storing the cleaned taxi trip data, while PgAdmin4 provides a visual interface to interact with the database. Here’s the docker-compose configuration I used:
1
2
3
4
5
6
7
8
9
10
11
12
13
14
15
16
17
18
19
20
21
22
23
24
25
26
27
28
29
30
31
32
33
34
35
36
37
38
39
40
41
42
43
44
45
services:
  postgres:
    image: postgres:13
    container_name: nyc_postgres
    environment:
      - POSTGRES_USER=*****
      - POSTGRES_PASSWORD=********
      - POSTGRES_DB=ny_taxi
    volumes:
      - postgres_data:/var/lib/postgresql/data
    networks:
      - project1-network
    ports:
      - "5432:5432"
    healthcheck:
      test: ["CMD-SHELL", "pg_isready -U admin -d ny_taxi"]
      interval: 1m30s
      timeout: 30s
      retries: 5
      start_period: 30s

  pgadmin:
    image: dpage/pgadmin4
    container_name: nyc_pgadmin
    environment:
      - PGADMIN_DEFAULT_EMAIL=****@****.com
      - PGADMIN_DEFAULT_PASSWORD=*****
    volumes:
      - pgadmin_data:/var/lib/pgadmin
    networks:
      - project1-network
    ports:
      - "8080:80"
    depends_on:
      postgres:
        condition: service_healthy

networks:
  project1-network:
    name: project1-network
    driver: bridge

volumes:
  postgres_data:
  pgadmin_data:
Run this command in the terminal to start the services (detachment mode):
1
docker-compose up -d
Wait until the services are up and running. Run docker ps in the terminal to make sure they’re running. Here’s what it looks like. 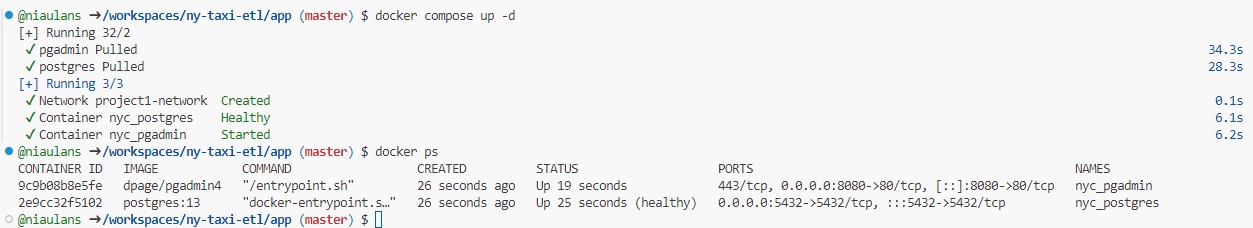
Once the containers are running, accessed PgAdmin 4 via browser at localhost:8080 and log in using the email and password defined earlier in docker-compose.yaml file.
After logging in, create a new database server for our project, fill the server name, host-name (same as in postgresql docker container name), port, username (same as in POSTGRES_USER), and password(same as in POSTGRES_PASSWORD).
If everything is setup correctly, we will be able to see our PostgreSQL database inside PgAdmin and ready to receive data.
Here’s the PgAdmin 4 interface after successfully connecting to the PostgreSQL database. 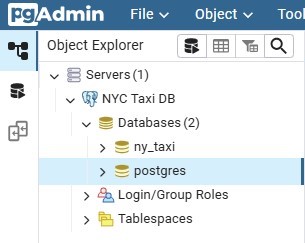
2. ETL Process
In this step, I used a Python script to perform the ETL (Extract, Transform, Load) process as part of this project pipeline. The first stage is Extract, where we download raw data from url.
Extract
Below is the Python code used for the extract process:
1
2
3
4
5
6
7
def extract(url):
    """Download file from URL and return file name"""

    file_name = url.rsplit('/', 1)[-1].strip()
    print(f'Downloading {file_name} ...')
    os.system(f'curl {url.strip()} -o {file_name}')
    return file_name
The extract() function is responsible for downloading a file from the given URL. It first extracts the filename by splitting the URL. Then, it uses the curl command to download the file. After the download is complete, the function returns the filename so it can be used in the next step of ETL pipeline
Transform
Once the raw dataset is extracted, the next step is transforming the data. This involves reading data from the downloaded files and preparing it for loading into PostgreSQL database. Here’s the function I used to perform the transformation:
1
2
3
4
5
6
7
8
9
10
11
12
13
14
def transform(file_name):
    """Read data from CSV or Parquet and return an iterator of DataFrames"""

    if file_name.endswith('.csv'):
        df = pd.read_csv(file_name, nrows=10)
        df_iter = pd.read_csv(file_name, iterator=True, chunksize=100000)
    elif file_name.endswith('.parquet'):
        file = pq.ParquetFile(file_name)
        df = next(file.iter_batches(batch_size=10)).to_pandas()
        df_iter = file.iter_batches(batch_size=100000)
    else:
        print('Error: Only .csv or .parquet files are allowed.')
        sys.exit()
    return df, df_iter
This transform() function is designed to handle both .csv and .parquet file formats:
- For CSV files, it reads a small preview (first 10 rows) and then prepared an iterator that reads the file in chunks of 100.000 rows. This is useful for processing large datasets in manageable parts.
- For Parquet files, it uses PyArrow to read the data in batches. It also returns a preview of the first 10 rows and prepares a batch iterator for chunking processing.
- If the file format is unsupported, the function will print an error and stop the script.
Load
The final step in the ETL process is loading the transformed data into the PostgreSQL database. This step takes the cleaned and chunked data and writes it into a target table inside the data warehouse. Below is the Python code used to load the data:
1
2
3
4
5
6
7
8
9
10
11
12
13
14
def load(df, df_iter, engine, table_name):
    """Load transformed data into the database"""

    df.head(0).to_sql(name=table_name, con=engine, if_exists='replace')
    count = 0

    for batch in df_iter:
        count += 1
        batch_df = batch.to_pandas() if hasattr(batch, 'to_pandas') else batch
        print(f'Inserting batch {count}...')
        batch_df.to_sql(name=table_name, con=engine, if_exists='append')
        print(f'Inserted!')

    print(f'Completed inserting {count} batches.')
This load() function first creates the table schema by using df.head(0).to_sql() and replaces if it already exists. It then loops through each chunk of data (df_iter) and inserts it into the database using the to_sql() function.
3. Create the Docker image
To ensure that the ETL process runs in a consistent environment, I wrap etl.py inside a Docker container using a Dockerfile. It looks like this.
1
2
3
4
5
6
7
8
9
10
11
12
13
14
FROM python:3.9.1

RUN apt-get update
RUN apt-get install wget

COPY requirements.txt .
RUN pip install --no-cache-dir -r requirements.txt

RUN mkdir /app
WORKDIR /app

COPY . .

ENTRYPOINT [ "python", "etl.py" ]
This image installs Python dependencies, copies the script and sets is as the default command. When this container runs it, it will automatically execute etl.py with arguments passed in.
Run this command in the terminal to build the image
1
docker build -t ny-taxi-etl:v01 .
4. Create a Bash script to automate the pipeline
Once the Docker image is ready, I create a bash script to automate the ETL process for multiple datasets. This script reads a .txt file (table_urls.txt) that contains the list of datasets and the target table names.
yellow_tripdata_jan2025 https://d37ci6vzurychx.cloudfront.net/trip-data/yellow_tripdata_2025-01.parquet
green_tripdata_jan2025 https://d37ci6vzurychx.cloudfront.net/trip-data/green_tripdata_2025-01.parquet
taxi_zone https://d37ci6vzurychx.cloudfront.net/misc/taxi_zone_lookup.csv
1
2
3
4
5
6
7
8
9
10
11
12
13
14
15
16
17
18
19
20
21
22
23
24
25
26
27
28
29
30
31
32
33
34
35
36
37
38
39
40
41
42
43
44
45
46
47
48
49
50
51
52
53
#!/bin/bash

# Ensure the script exits if any command fails
set -e

# Path to the file containing table names and URLs
FILE="table_urls.txt"

# Debug: Display the file contents before looping
echo "Reading table_urls.txt..."
cat "$FILE"
echo "------------------------------------"
echo ""

# Record the start time of the entire process
START_TOTAL=$(date +%s)

# Loop through each line in the file
while IFS=" " read -r TABLE_NAME URL || [[ -n "$TABLE_NAME" ]]
do
    echo "Processing table: $TABLE_NAME"

    # Record the start time for this table's process
    START_TIME=$(date +%s)

    docker run --rm -t \
        --network=project1-network \
        --name "ny-taxi-container-$TABLE_NAME" \
        ny-taxi-etl:v01 \
            --user=admin \
            --password=admin123 \
            --host=nyc_postgres \
            --port=5432 \
            --db=ny_taxi \
            --table_name="$TABLE_NAME" \
            --url="$URL"

    # Calculate the duration for this table's process
    END_TIME=$(date +%s)
    DURATION=$((END_TIME - START_TIME))

    echo "Finished processing $TABLE_NAME"
    echo "Total time: $DURATION seconds"
    echo "------------------------------------"

done < "$FILE"

# Calculate the total duration for all tables
END_TOTAL=$(date +%s)
TOTAL_DURATION=$((END_TOTAL - START_TOTAL))

echo "All tables processed!"
echo "Total execution time: $TOTAL_DURATION seconds"
For each entry of table_urls.txt, the script runs a Docker container using the image ny-taxi-etl-v01, passing necessary parameters like database credentials, table name, and data URL. The ETL process inside the container will:
- Extract the data file from the provided URL using
extract()function frometl.py. - Transform the file by reading it in chunks
- Load the cleaned and transformed data into the specified table in PostgreSQL database.
This process is repeated for each line in the table_urls.txt file. At the end of each run, the script logs the time it took to process each dataset and then prints the total execution time once all datasets are processed.
5. Run Everything
Run this command in the terminal to execute the file
1
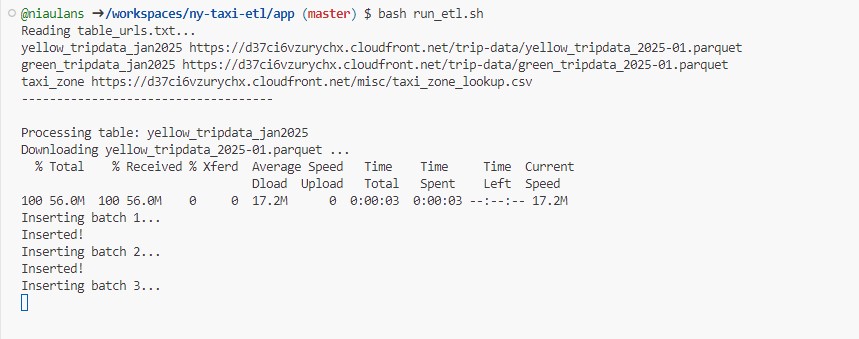
bash run_etl.sh
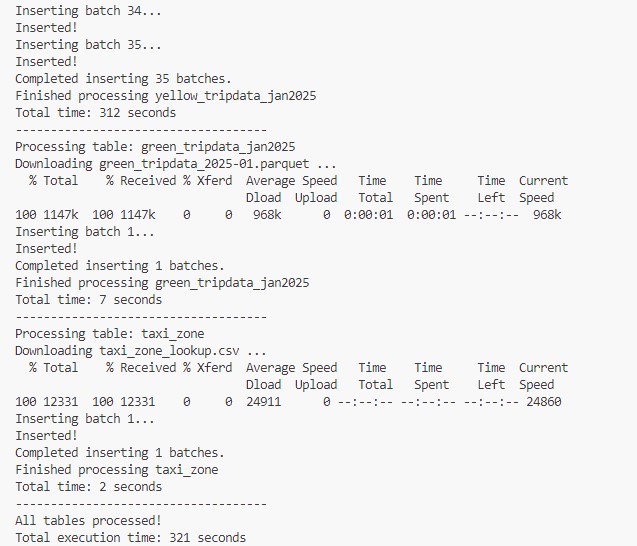
Below is the initial output when the process start running.
Once the process is complete, you’ll see a summary of the execution, including how long it took to process each table and the total execution time for all datasets. As shown in the image below.
To verify whether the data has been successfully loaded into the database, we can check it using PgAdmin 4.
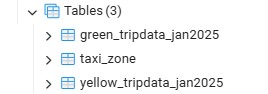
The image above shows that the tables have been successfully created.
That alone is not enough — we also need to check the data inside those tables. Let’s check the total number of records in each table. The SQL query to check will be like this.
1
2
3
4
5
SELECT 'yellow_tripdata' AS table_name, COUNT(*) FROM yellow_tripdata_jan2025
UNION ALL
SELECT 'green_tripdata', COUNT(*) FROM green_tripdata_jan2025
UNION ALL
SELECT 'taxi_zone', COUNT(*) FROM taxi_zone;
And the result:
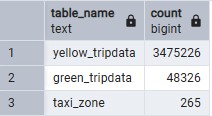
Finally, the data verified succeccfully extracted, transformed, and loaded into the PostgreSQL database.
5. Visualize with Power BI
Once the data is successfully loaded into PostgreSQL database, it can be visualize using Power BI to uncover meaningful insights and trends. Since this project uses GitHub Codespaces and PostgreSQL is running inside a Docker container, there are a few steps required to connect Power BI on your local computer to the PostgreSQL database.
Steps to connect Power BI to PostgreSQL (docker container):
- Install GitHub CLI (if not already)
👉 https://cli.github.com/ - Authenticate & start a port forwarding session. Run this command in local terminal
1
2
gh auth login
gh codespace ports forward 5432:5432
- Open Power BI Desktop
- Choose PostgreSQL database as the data source.
- Set server to
localhostand database tony_taxi
- Load tables and start building dashboard.
The snapshot of the dashboard I have created is given below.
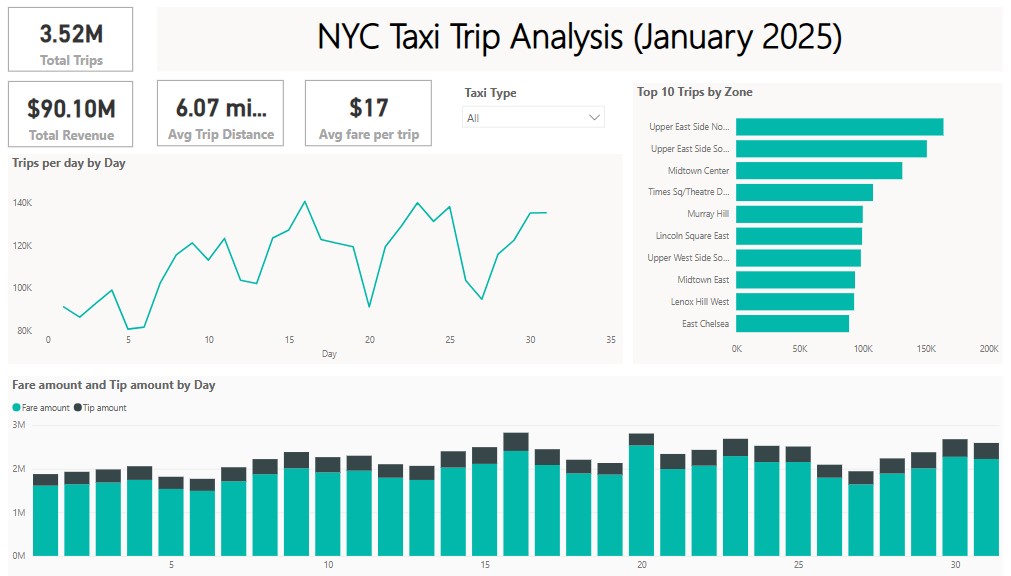 Overall Taxi Data
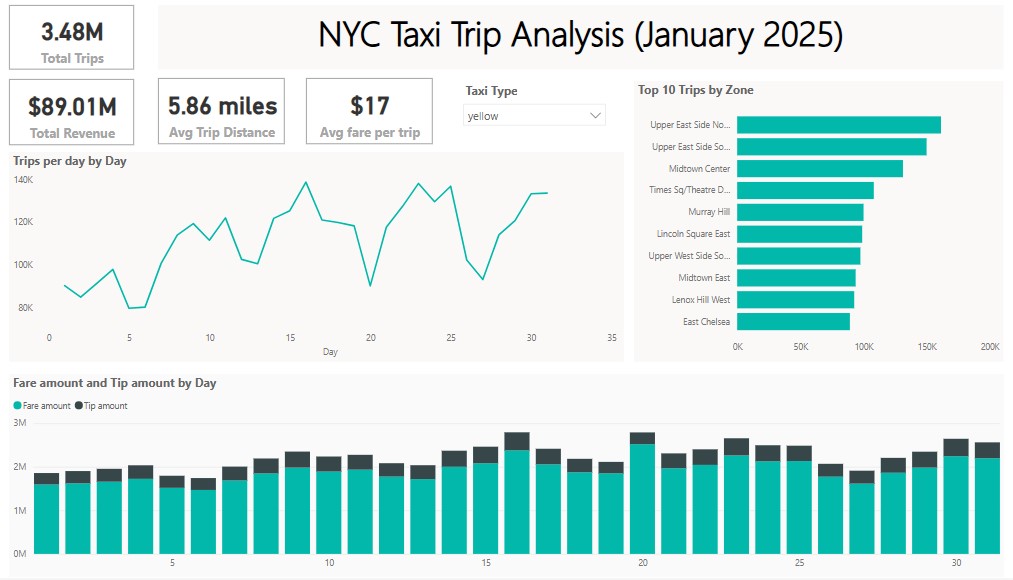 Yellow Taxi
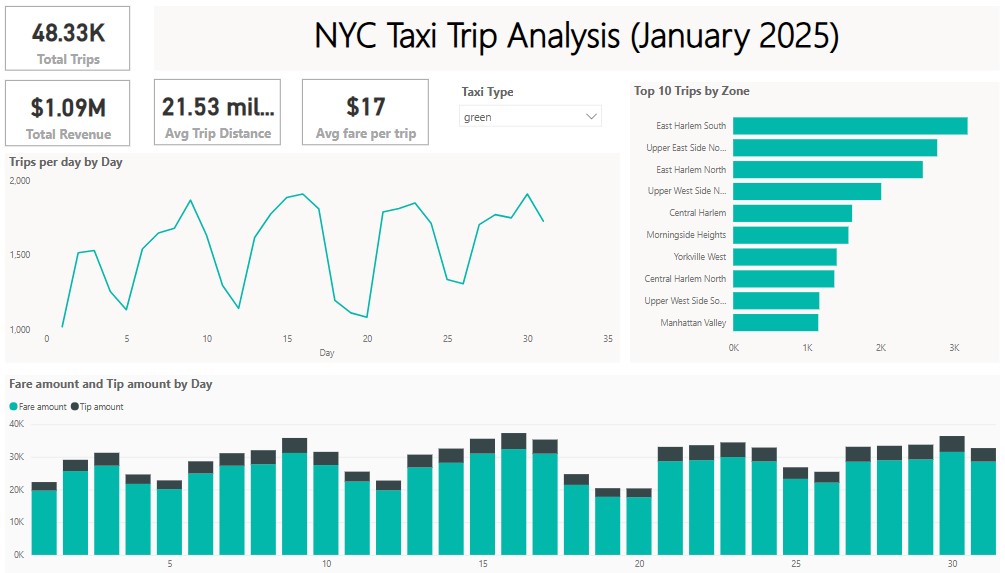 Green Taxi
You can check the interactive version here
Conclusion
This project demonstrates a complete end-to-end ETL pipeline built using Docker, PostgreSQL, PgAdmin 4, and Python. The raw NYC Taxi datasets were successfully extracted from external URLs, transformed into clean and structured formats, and finally loaded into a PostgreSQL database hosted in a containerized environment. The final data was verified using PgAdmin.
With this project, I learned how to integrate multiple technologies into a cohesive data engineering solution. This setup can be extended further to include orchestration tools like Apache Airflow.
The full code for this project can be accessed in my GitHub repository here.
Let’s learn and grow together. Thank you for reading! 🌷